Bond duration is a measure of how sensitive a bond’s price is to changes in interest rates. It also tells you how long it will take to recover the initial cost of the bond from its cash flows. The higher the duration, the more the bond’s price will fluctuate when interest rates change. Duration depends on two factors: the time to maturity and the coupon rate of the bond. The longer the time to maturity, the higher the duration, because the bond is exposed to more interest rate risk. The higher the coupon rate, the lower the duration, because the bond pays back its cost faster. There are different types of duration, such as Macaulay duration, modified duration, and Fisher-Weil duration, that use different methods to calculate the bond’s sensitivity and payback period.
Basic Theory:
Bond duration is a measure of the average time it takes for the present value of a bond’s cash flows to be repaid. It helps investors assess the interest rate risk associated with their bond investments. The duration of a bond is expressed in years and provides insight into how the bond’s price will change in response to interest rate movements.
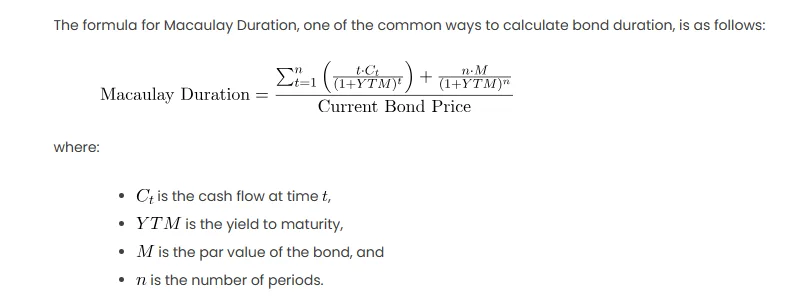
The formula for Macaulay Duration, one of the common ways to calculate bond duration, is as follows:
where:
is the cash flow at time
,
is the yield to maturity,
is the par value of the bond, and
is the number of periods.
Procedures for Calculating Bond Duration in Excel:
- Prepare Your Data:
- Set up an Excel table with columns for cash flows, the period, and the present value of each cash flow.
- Calculate Present Values:
- Use Excel’s PV function to calculate the present value of each cash flow. The formula is
, where rate is the discount rate (YTM), nper is the period, pmt is the cash flow, and FV is the future value (par value).
- Use Excel’s PV function to calculate the present value of each cash flow. The formula is
- Calculate Macaulay Duration:
- Apply the Macaulay Duration formula using the calculated present values.
- Interpret the Result:
- A higher duration implies higher interest rate risk. For example, if the Macaulay Duration is 5 years, a 1% increase in interest rates could lead to a roughly 5% decrease in the bond’s price.
Scenario with Real Numbers:
Consider a 5-year bond with a par value () of $1,000, a coupon rate of 5%, and a yield to maturity (
) of 4%. The cash flows are as follows:
Using Excel, calculate the present value for each period and then apply the Macaulay Duration formula.
Excel Table:
| Period | Cash Flow | PV at 4% |
|---|---|---|
| 1 | $50 | =PV(4%, 1, 50, 1000) |
| 2 | $50 | =PV(4%, 2, 50, 1000) |
| 3 | $50 | =PV(4%, 3, 50, 1000) |
| 4 | $50 | =PV(4%, 4, 50, 1000) |
| 5 | $50 | =PV(4%, 5, 50, 1000) |
Macaulay Duration Calculation:
*** QuickLaTeX cannot compile formula:
\[ \text{Macaulay Duration} = \frac{\sum_{t=1}^{5} \left( \frac{t \cdot \text{PV at 4%}_t}{(1 + 0.04)^t} \right) + \frac{5 \cdot 1000}{(1 + 0.04)^5}}{\text{Current Bond Price}} \]

*** Error message:
File ended while scanning use of \frac .
Emergency stop.
Result:
The calculated Macaulay Duration represents the average time it takes to recover the investment in present value terms, indicating the bond’s sensitivity to interest rate changes.
Other Approaches:
- Modified Duration:
- Another widely used measure is Modified Duration, which is the Macaulay Duration divided by
, where
is the number of compounding periods per year.
- Another widely used measure is Modified Duration, which is the Macaulay Duration divided by
- Excel Functions:
- Excel has built-in functions such as DURATION and MDURATION that simplify the calculation of Macaulay Duration and Modified Duration, respectively.

