The Purchasing Power Theorem is a fundamental concept in economics that elucidates the dynamic relationship between the value of money and changes in the overall price level of goods and services. Essentially, it highlights the impact of inflation on the purchasing power of a given currency. In simple terms, as the general price levels rise due to inflation, the purchasing power of money diminishes, meaning that the same amount of money will enable individuals or businesses to buy fewer goods and services over time. This theorem underscores the importance of considering inflationary trends when assessing the real value of financial resources and making informed economic decisions. It serves as a critical tool for understanding how the changing value of money influences economic transactions and financial planning in the face of fluctuating price levels.
Basic Theory:
The Purchasing Power Theorem asserts that the value of money is not constant and is affected by changes in the general price level of goods and services. Inflation erodes the purchasing power of money, meaning that the same amount of money can buy fewer goods and services as time progresses.
Procedures:
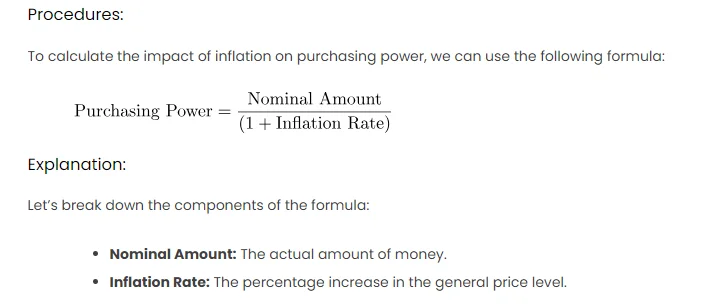
To calculate the impact of inflation on purchasing power, we can use the following formula:
Explanation:
Let’s break down the components of the formula:
- Nominal Amount: The actual amount of money.
- Inflation Rate: The percentage increase in the general price level.
Scenario:
Consider a scenario where you have $1,000, and the inflation rate is 3% annually. To find the real value of your $1,000 after one year, you can use the Purchasing Power formula.
Excel Implementation:
| Description | Value | Formula | Result |
|---|---|---|---|
| Initial Amount | $1,000 | ||
| Inflation Rate | 3% | ||
| Purchasing Power | =B2/(1+B3) | =C2 |
Calculation:
Result:
After one year with a 3% inflation rate, the real value of $1,000 is approximately $970.87.
Other Approaches:
- Using Future Value Formula: Another way to approach this is by using the future value formula with a discount rate. The formula is
.
- Graphical Representation: Create a line graph in Excel to visually represent the decline in purchasing power over multiple years at different inflation rates.

