The Present Value of an Ordinary Annuity is a financial concept that assesses the current worth of a series of equal cash inflows or outflows occurring at regular intervals over a specified period. This theorem is fundamental in business mathematics and plays a crucial role in financial planning. Essentially, it helps individuals or businesses evaluate the current value of future cash flows by discounting them back to their present value, considering the time value of money. The concept assumes that the cash flows are ordinary, meaning they occur at the end of each period. The calculation involves factoring in the interest rate and the number of periods, enabling decision-makers to make informed choices regarding investments, loans, or other financial decisions. Excel is a powerful tool in applying this theorem, allowing for efficient and accurate computations, aiding individuals and businesses in understanding the implications of cash flows over time.
Basic Theory:
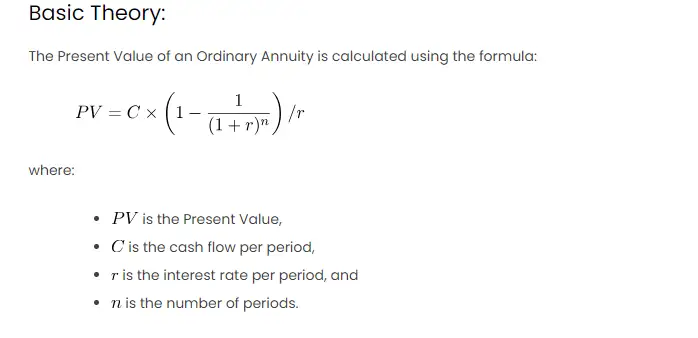
The Present Value of an Ordinary Annuity is calculated using the formula:
where:
is the Present Value,
is the cash flow per period,
is the interest rate per period, and
is the number of periods.
Procedures in Excel:
Let’s break down the steps to perform this calculation in Excel:
- Data Input: Create an Excel table with columns for period (t), cash flow (C), interest rate (r), and present value (PV).
- Input Values: Enter the number of periods, cash flow per period, and interest rate per period in the respective columns.
- Formula Application: In the PV column, apply the formula using the Excel function
PV(rate, nper, pmt).
Example:
Let’s consider a scenario where you receive an annual payment of $1,000 for 5 years with an annual interest rate of 8%. We want to find the present value of these future cash flows.
Other Approaches:
- Manual Calculation: The formula provided can be manually calculated without using the Excel function. However, Excel’s built-in functions provide a more efficient and less error-prone method.
- Data Table: Excel’s data table feature can be used to analyze the impact of different interest rates or cash flows on the present value. This is particularly helpful for sensitivity analysis.
- Graphical Representation: Create a line graph to visually represent the present value for different interest rates or periods. This can aid in understanding the relationship between these variables.

