The Consumer Price Index (CPI) is a statistical measure that reflects changes in the average prices of goods and services purchased by households over time. It serves as an indicator of inflation, providing insights into the cost of living for consumers. CPI is calculated by comparing the current prices of a predetermined basket of goods and services to their prices in a base period. The index is expressed as a percentage change, representing the overall inflation or deflation in the economy. Policymakers, economists, and businesses use CPI data to make informed decisions about economic policy, wage adjustments, and investment strategies. It is a valuable tool for assessing the impact of price fluctuations on consumers’ purchasing power and maintaining economic stability.
Basic Theory:
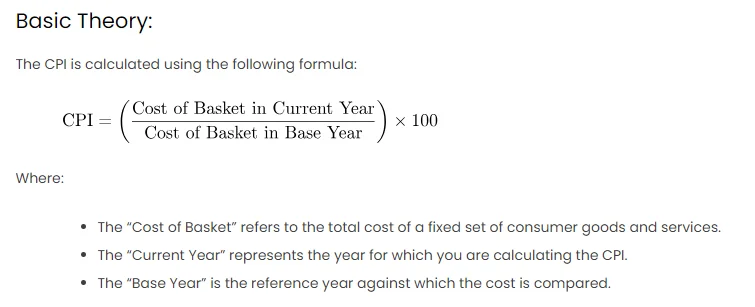
The CPI is calculated using the following formula:
Where:
- The “Cost of Basket” refers to the total cost of a fixed set of consumer goods and services.
- The “Current Year” represents the year for which you are calculating the CPI.
- The “Base Year” is the reference year against which the cost is compared.
Procedures:
- Select the Basket of Goods:
- Define a representative basket of goods and services. This should include items commonly purchased by consumers, such as food, housing, transportation, and healthcare.
- Determine Prices:
- Gather the prices of each item in the basket for both the current year and the base year. Ensure that the items and quantities remain constant between the two years.
- Calculate the Cost of the Basket:
- Multiply the prices by the quantities for each item and sum them to obtain the total cost of the basket for both the current and base years.
- Apply the CPI Formula:
- Use the CPI formula to calculate the index by dividing the cost of the basket in the current year by the cost in the base year, then multiply by 100.
Scenario:
Let’s consider a simplified scenario with three items in our basket: apples, bread, and gasoline. We have the following data:
- Base Year (2020) prices:
- Apples: $1.00 per pound
- Bread: $2.00 per loaf
- Gasoline: $2.50 per gallon
- Current Year (2023) prices:
- Apples: $1.20 per pound
- Bread: $2.50 per loaf
- Gasoline: $3.00 per gallon
Calculation:
- Calculate the Cost of the Basket:
- Apply the CPI Formula:
Excel Table:
| Item | Quantity | Base Year Price | Current Year Price |
|---|---|---|---|
| Apples | 5 pounds | $1.00 | $1.20 |
| Bread | 2 loaves | $2.00 | $2.50 |
| Gasoline | 10 gallons | $2.50 | $3.00 |
Result:
The Consumer Price Index (CPI) for the given scenario is approximately 117.14, indicating a 17.14% increase in prices from the base year (2020) to the current year (2023).
Other Approaches:
- Using a CPI Calculator:
- Excel provides various financial functions. You can use the
INDEXfunction to streamline CPI calculations, making your spreadsheet more dynamic.
- Excel provides various financial functions. You can use the
- Graphical Representation:
- Create a line chart to visually represent the CPI trends over multiple years. This provides a clearer picture of inflationary or deflationary periods.


